The first certified methodology for passengers´ transport demand calculation using BIGDATA from mobile networks
New data, which at present cannot be measured in any known manner, shall be available. These include overall transport demand and passenger transport demand according to transport modes related to the territorial unit – municipality for a time unit of a day, or hour of a day.
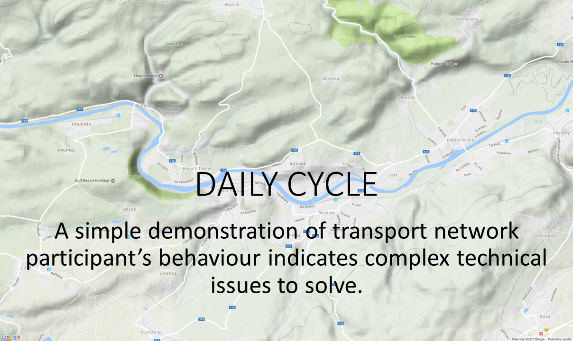
A simple demonstration of transport network participant’s behaviour indicates complex technical issues to solve
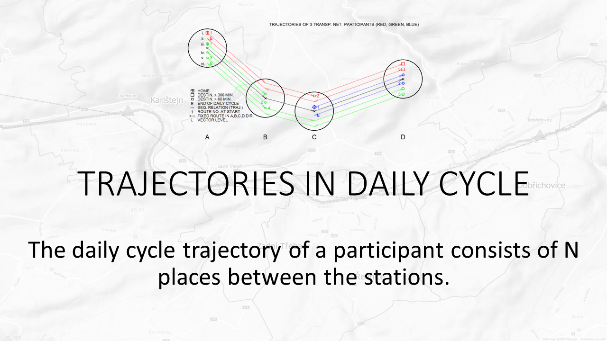
Participant’s daily cycle trajectory consists of N places between the stations in accordance with the pre-defined detail of aggregation. It represents the sequence of stations during the daily cycle. For the purpose of the assessment of the territory conditions from the methodology point of view, the monitored point on the trajectory is staying in the station for a pre-defined time slot. Not all changes of places (movement in the space and time) are regarded as trajectory definition points.
A simple model of the three network participants demonstrate the differences in aggregated numerical characteristics of spatial and temporal mobility
The stations are perceived as spatial boundaries for the task. Stations can also be interpreted as the place of the realisation of activities, projects and passenger routines. From the spatial point of view, the stations are fixed. From the spatial point of view, the stations are defined by a polygon. For the purpose of processing data tasks, the polygon is represented by a definition point.
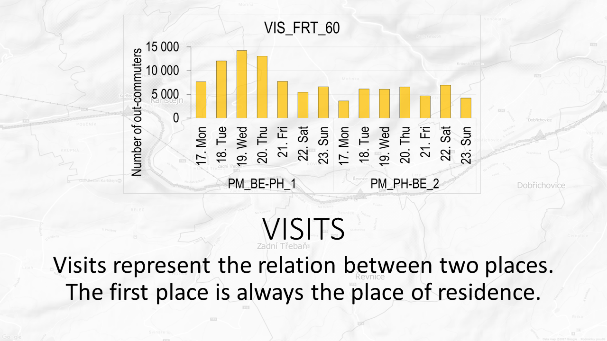
See how “VISITS” indicator is established
Visits represent the relation between two places (trajectory definition points). The first place is always the place of residence and complementing information is the out-commuting destination. This is the representation of the relation of two administrative units (according to the aggregation level) and the number of people in these units. Passengers are assigned a single place of residence for a particular day. They may, however, have several out-commuting destinations.
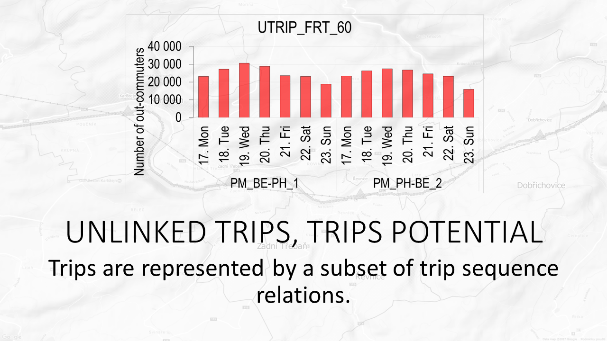
See how “TRIPS” indicator is established
Trips represent a sequence relation between two places (trajectory definition points), with the first and last place in the sequence being the place of residence within the daily cycle. This represents the sequence relation of the stations during the daily cycle. A participant may report any number of out-commuting and in-commuting stations (limited only by the number of monitored time slots) in a particular day.
modata-method | Copyright © 2016 VŠB-TU Ostrava. All Rights Reserved. | Contact: miroslav.voznak@vsb.cz